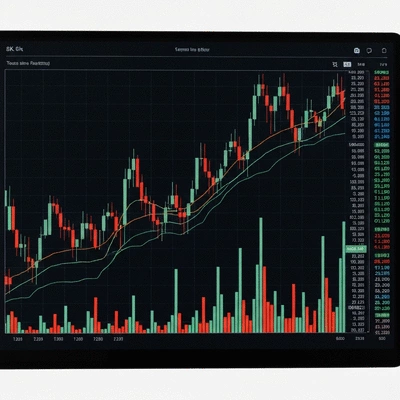
Candlesticks: Market Sentiment
Graphical representation showing open, high, low, and close prices for a specific time frame, revealing market sentiment.
Open, High, Low, Close
Have you considered how mastering the art of reading crypto price charts can transform your trading strategy? Understanding these charts is not just a luxury; it's a necessity for anyone looking to thrive in the unpredictable world of cryptocurrency.
Mastering crypto price charts involves understanding key visual components and analytical tools to make informed trading decisions. Below is a breakdown of essential elements.
Graphical representation showing open, high, low, and close prices for a specific time frame, revealing market sentiment.
Indicates the amount of a cryptocurrency traded over a period, gauging the strength behind price movements. Higher volume usually means stronger trends.
Identifies the overall direction of price movement (upward, downward, or sideways) to understand market trajectory.
Smooths out price data by creating a constantly updated average price, helping to identify trends more clearly and reduces noise.
Lines drawn across significant price points to visualize market trajectory and identify support/resistance levels.
Advanced indicators (Relative Strength Index, Moving Average Convergence Divergence, Bollinger Bands) used to enhance analysis and predict movements.
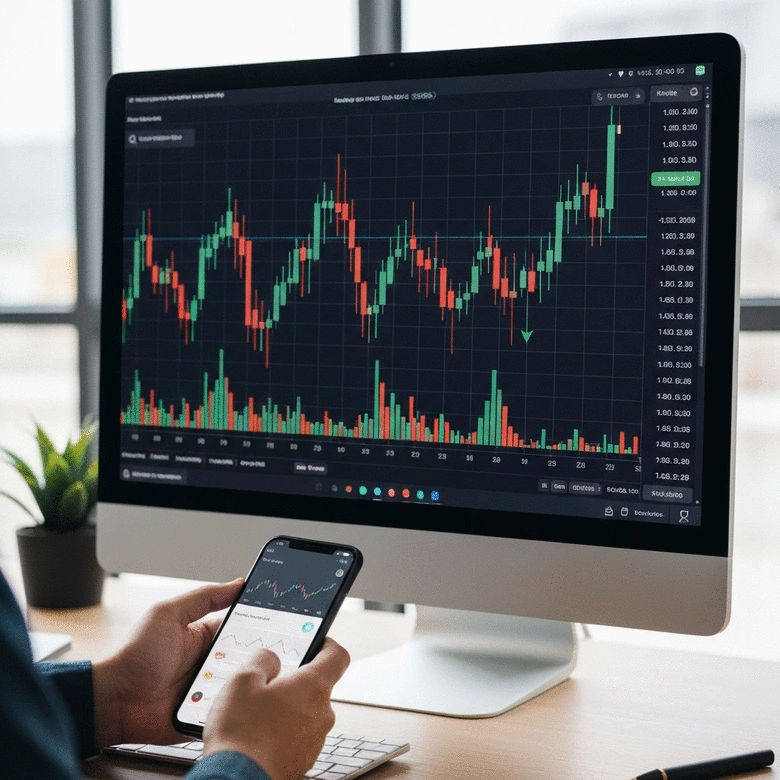
Have you ever felt overwhelmed by the seemingly chaotic world of crypto trading? Understanding crypto price charts can significantly enhance your ability to navigate these turbulent waters. They serve as a visual representation of market movements, enabling traders and investors to make informed decisions based on historical data and trends. In this section, we'll break down the basics of technical analysis and explore why mastering price charts is essential for anyone looking to thrive in the cryptocurrency market.
Crypto price charts track the price movements of various cryptocurrencies over time. They provide insights into how the market reacts to different events and trends. By analyzing these charts, we can identify patterns that may indicate future price movements. This is crucial for traders who want to make timely decisions, especially during volatile periods. The Chicago Fed has highlighted the importance of understanding market dynamics in the context of digital assets.
Ultimately, understanding crypto price charts allows us to assess market conditions better and respond proactively. So, it's not just about numbers; it's about insight and strategy!
When diving into crypto charts, three critical elements come into play: candlesticks, trading volume, and trends. Each of these components provides unique insights that can influence our trading strategies. Understanding Bitcoin's volatility, for example, often relies on a thorough analysis of these elements.
By mastering these elements, we can make better predictions about potential price movements. Remember, it's not just about what the chart shows at a glance; it’s about what those movements mean for our trading strategy!
Chart indicators are indispensable tools for any trader looking to refine their analysis. Two of the most commonly used indicators are moving averages and trend lines. They provide additional context to the raw data that price charts present. For more detailed insights into market liquidity and trends, State Street Global Advisors offers valuable perspectives on Bitcoin's volatility and liquidity.
By incorporating these indicators into our analysis, we can enhance our ability to anticipate price movements and make informed trading decisions. The more we practice with these tools, the more confident we become in our trading strategies!
When analyzing crypto price charts, consider using multiple time frames for your analysis. This approach allows you to identify both short-term and long-term trends, giving you a more comprehensive view of market movements. For instance, a daily chart may show a bullish trend, while a weekly chart might reveal a potential reversal. By aligning your strategies across different time frames, you can enhance your trading decisions and better anticipate price fluctuations.
As we wrap up our exploration of crypto price charts, it’s crucial to highlight some essential techniques and strategies that can empower you as a trader. Understanding these fundamentals will not only help you make informed decisions but also enhance your ability to navigate market downturns effectively. Here’s a concise recap of the key points we covered:
By implementing these strategies, you'll be in a stronger position to anticipate market movements and make decisions that align with your investment goals. Remember, the crypto landscape can change quickly, and staying informed is your best defense against volatility.
Looking ahead, applying the insights gained from analyzing crypto price charts can significantly enhance your trading strategy during market downturns. It’s not just about recognizing patterns but also understanding how to act upon them. Here are some practical approaches:
Applying these insights requires a balanced approach. Take your time to assess the market conditions and rely on your chart analysis before diving into any trades.
At CryptoMarketCrash Insights, we believe that sharing experiences is invaluable. I encourage you to join the conversation! Have you faced challenges during market downturns? What strategies worked for you? Engaging with fellow traders not only helps in exchanging ideas but also fosters a supportive community that can navigate the crypto landscape together.
As the cryptocurrency market evolves, so do the investment trends. It’s essential to stay updated on emerging strategies that can enhance your portfolio. Consider looking into:
Exploring these trends will equip you with the knowledge to make better investment choices.
Now is the perfect time to put your knowledge into practice! Start analyzing crypto charts today to enhance your decision-making skills. Remember, each chart tells a story, and your ability to interpret those stories can lead to successful trading outcomes. Join our community at CryptoMarketCrash Insights, where we provide the latest updates and expert analysis to support your journey in the cryptocurrency market!
Here is a quick recap of the important points discussed in the article:
Liam Harrington is a seasoned cryptocurrency analyst and market strategist with over a decade of experience in financial markets. He demystifies complex market trends, empowering traders and investors to make informed decisions. His expertise spans market analysis, risk management, and recovery strategies, making him a trusted voice in the crypto community.
At CryptoMarketCrash Insights, we're your essential guide through the volatile crypto landscape. We provide real-time news, expert analysis, and recovery strategies for Bitcoin and altcoin drops, empowering you to navigate market crashes effectively.
Navigating Crypto Volatility Together