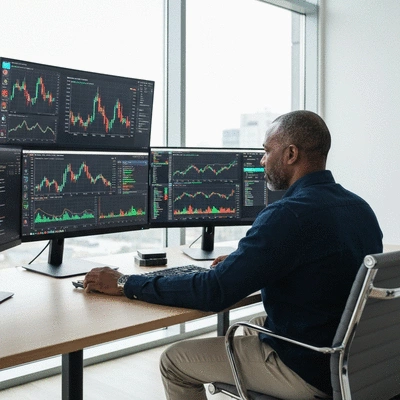
Price Charts
Visual representations of market data over time.
Have you considered how mastering technical analysis could transform your cryptocurrency trading strategy? Understanding the nuances of this approach might just be the key to navigating the volatile market effectively.
A quick overview of technical analysis components and crucial indicators used for predicting cryptocurrency prices.
Visual representations of market data over time.
Tools to interpret price movements and market sentiment.
Recurring chart formations suggesting future price direction.
Identify market direction (e.g., Moving Averages, Support/Resistance).
Gauge strength of price movements (e.g., RSI, MACD).
Measure the rate of price fluctuations (e.g., Bollinger Bands).
Understanding market sentiment through trading activity.
Focuses on historical price data & volume to predict future movements. Looks at "what" & "how" of price action.
Evaluates intrinsic value of an asset (tech, team, use case). Asks "why" an asset is valued.
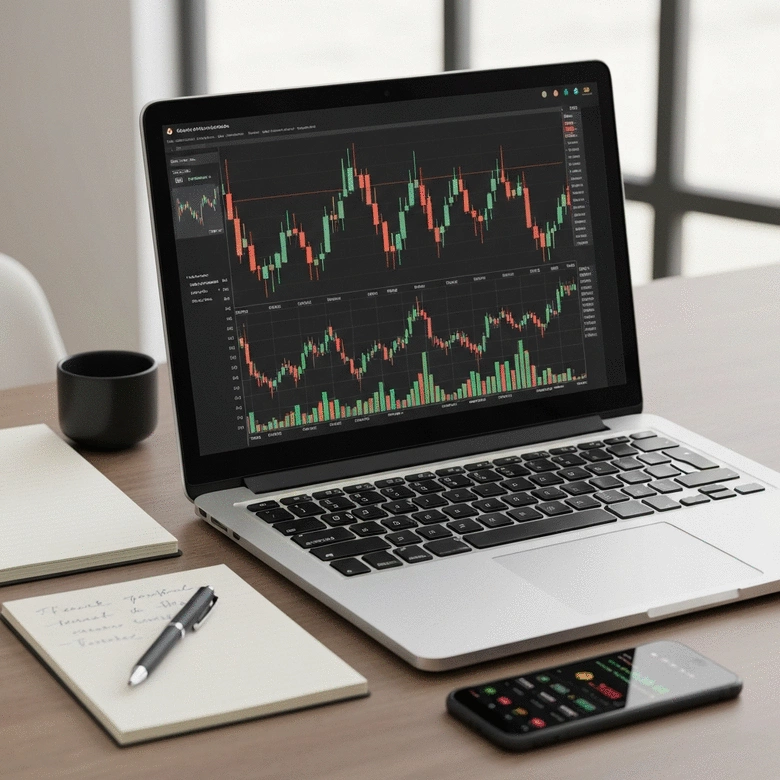
Have you ever wondered how traders predict the wild swings in cryptocurrency prices? Understanding technical analysis is key to grasping these market movements. At CryptoMarketCrash Insights, I believe that having a solid grasp of technical analysis can give you the edge you need in navigating the unpredictable crypto landscape. Let's dive into what technical analysis really means for cryptocurrency trading.
In the world of cryptocurrency, technical analysis (TA) involves using historical price data to forecast future price movements. This method relies on the belief that market trends, fueled by the collective behavior of traders, often repeat themselves. By studying charts and patterns, you can gain insights into market sentiment and price direction. According to a recent report by the U.S. Department of the Treasury, the rise of digital assets has brought a renewed focus on sophisticated analytical tools for market understanding.
Understanding these components is crucial for anyone looking to make informed trading decisions. By leveraging technical analysis, you can predict potential market crashes or recoveries, keeping your portfolio in a healthy state.
While technical analysis focuses on price movements and market sentiment, fundamental analysis (FA) digs into the intrinsic value of an asset. This includes evaluating a cryptocurrency's technology, use case, team, and market demand. In essence, TA looks at the "what" and "how" of price action, while FA asks "why" a particular asset is valued as it is. A comprehensive guide by PwC on navigating the global crypto landscape highlights the importance of both approaches for a holistic view.
Both methods have their place in trading strategies. Combining insights from both technical and fundamental analyses can provide you with a well-rounded perspective, ensuring you make informed decisions as you navigate the often tumultuous world of crypto.
Now that we understand the basics, let’s explore the key indicators that can enhance your ability to predict cryptocurrency prices. Armed with this information, you'll be better equipped to make strategic decisions in your trading journey!
Each of these indicators plays a unique role and can provide valuable insights into market trends. Let's break them down further to see how they can help you in your trading strategy.
Trend indicators are essential for identifying the direction of the market. They help traders understand whether a cryptocurrency is in an uptrend, downtrend, or sideways movement. Using these indicators can significantly enhance your trading decisions.
Knowing how to read these indicators can empower you to make timely entries and exits. Being in the right position can mean the difference between a successful trade and a missed opportunity!
Moving averages smooth out price data to help identify trends. The Simple Moving Average (SMA) calculates the average price over a specific time frame, while the Exponential Moving Average (EMA) gives more weight to recent prices. This makes the EMA more responsive to price changes.
Incorporating moving averages into your analysis can provide clarity and help you spot potential buy and sell opportunities!
Support and resistance levels are crucial for identifying potential reversal points in the market. A support level is where buying interest is strong enough to overcome selling pressure, while resistance is where selling pressure can outweigh buying interest. Recognizing these levels can help you anticipate price movements.
To summarize, mastering technical analysis not only enhances your understanding of market dynamics but also equips you with practical tools to navigate the crypto landscape effectively. Stay tuned as we delve deeper into momentum indicators and more!
Did you know? Incorporating a combination of trend, momentum, and volatility indicators can significantly enhance your trading strategy. By not relying solely on one type of indicator, you can gain a more comprehensive view of market conditions, helping you make better-informed decisions in the fast-paced crypto environment!
As we wrap up our discussion on technical analysis, it’s essential to consider its role in crypto trading. While no method guarantees success, technical analysis can provide traders with valuable insights into market trends. By understanding price movements and patterns, we empower ourselves to make informed decisions, reducing the emotional rollercoaster that often accompanies crypto investments!
One key aspect to consider is the effectiveness of technical analysis in predicting price movements. This involves understanding how well these tools and indicators have performed in past market conditions. Here are a few ways to evaluate their effectiveness:
By applying these evaluation methods, we can enhance our trading strategies. Remember, it’s not just about the analysis; it’s about learning and adapting from our experiences!
The cryptocurrency landscape is ever-evolving, which makes continuous learning crucial. As a trader, staying informed about market trends, news, and updates can significantly impact your trading decisions. Here are some tips to ensure you remain knowledgeable:
By committing to ongoing education, you'll not only enhance your understanding of technical analysis but also improve your overall trading performance.
Are you ready to dive into the world of technical analysis? Getting started can be both exciting and overwhelming. However, with the right resources and community support, you can navigate this journey confidently!
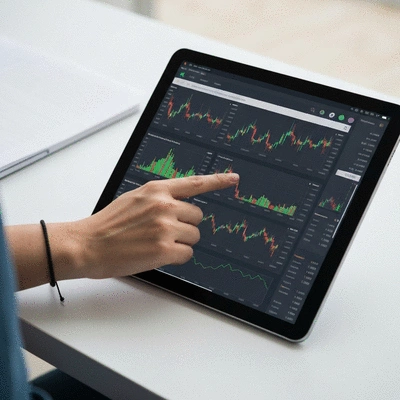
To begin, I recommend exploring various free charting tools that can help you visualize data effectively. Here are some excellent options to check out:
Utilizing these tools can enhance your technical analysis skills and provide you with the insights you need to succeed.
The crypto world is vast, and connecting with fellow traders can enrich your learning experience. Joining a community allows you to share insights and gain different perspectives. Consider engaging with:
As we at CryptoMarketCrash Insights always encourage, sharing experiences can lead to new strategies and enhance our collective knowledge! For a broader understanding of crypto adoption and market dynamics, insights from the Chainalysis 2024 Global Crypto Adoption Index can be particularly valuable.
Finally, let's explore the potential of trading bots and algorithmic trading. These tools can assist in executing trades based on specific criteria, allowing for quicker responses to market changes. Here are a few benefits of using them:
By integrating these technologies into your trading strategy, you can enhance your effectiveness in navigating the crypto markets.
Here is a quick recap of the important points discussed in the article:
Liam Harrington is a seasoned cryptocurrency analyst and market strategist with over a decade of experience in financial markets. He demystifies complex market trends, empowering traders and investors to make informed decisions. His expertise spans market analysis, risk management, and recovery strategies, making him a trusted voice in the crypto community.
At CryptoMarketCrash Insights, we're your essential guide through the volatile crypto landscape. We provide real-time news, expert analysis, and recovery strategies for Bitcoin and altcoin drops, empowering you to navigate market crashes effectively.
Navigating Crypto Volatility Together