What Are Crypto Price Charts?
Visual representations of cryptocurrency price movements over time, crucial for informed trading decisions.
Have you ever felt overwhelmed trying to decipher the intricate patterns of crypto price charts? You're not alone. Mastering these visuals can profoundly influence your trading strategies, empowering you to make informed decisions that navigate the unpredictable crypto landscape.
Delve into the fundamental elements that make up crypto price charts, illustrating how each component contributes to a comprehensive market analysis.
Visual representations of cryptocurrency price movements over time, crucial for informed trading decisions.
Have you ever felt lost when looking at a crypto price chart? You're not alone! Crypto price charts are visual representations of a cryptocurrency's price movements over time. They play a crucial role in cryptocurrency trading, providing traders with the information they need to make informed decisions. At CryptoMarketCrash Insights, we believe that understanding these charts is essential for navigating the volatile crypto landscape.
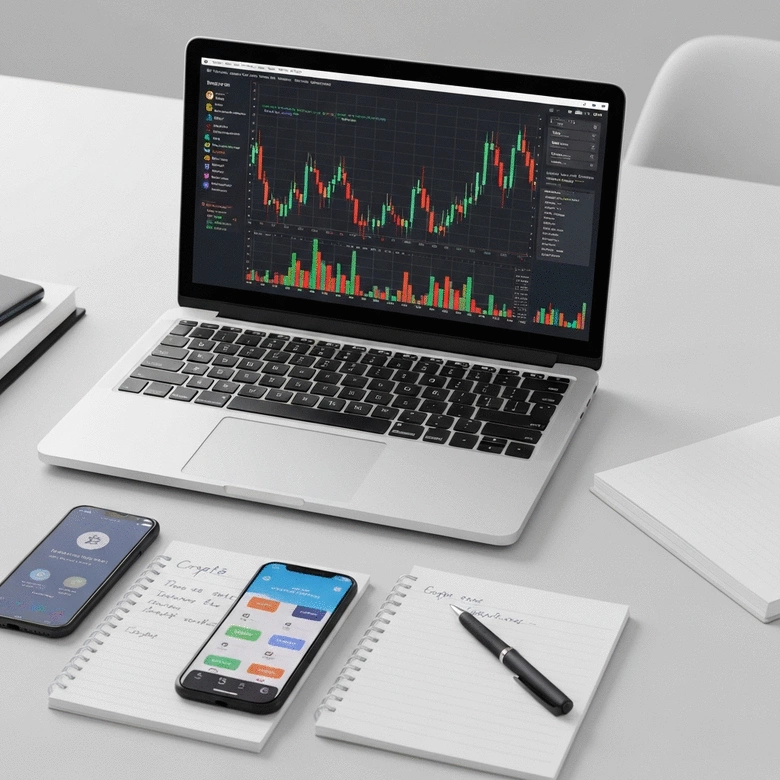
Crypto price charts are graphical representations that plot the price of cryptocurrencies, like Bitcoin and Ethereum, against time. They typically display various data points, such as opening, closing, high, and low prices. By visualizing this data, traders can identify trends and patterns that inform their trading strategies. It's like having a roadmap for your investments!
Understanding these components helps traders gauge market sentiment and make strategic decisions. So, whether you're just starting or looking to refine your strategy, getting familiar with crypto price charts is a great first step!
Learning to read crypto price charts equips you with valuable insights for making informed trading decisions. By understanding price dynamics, you can better identify market trends and spot potential buying or selling opportunities. This knowledge is vital, especially during periods of high volatility, where swift decisions can make a big difference!
By mastering these skills, you'll enhance your confidence in trading and be better prepared to navigate the ups and downs of the crypto market!
Analyzing crypto price charts requires understanding several key components. Familiarity with these elements can significantly enhance your trading effectiveness. Here are the essentials:
By focusing on these components, you can start making sense of the market and gaining a better understanding of price action. Remember, the more you practice, the more intuitive it will become!
Candlestick charts are a popular method for displaying price movements in the crypto market. Each candlestick represents price action for a specific time frame, showing the opening, closing, high, and low prices. There are two main types of candlesticks: bullish and bearish.
By recognizing these patterns, traders can gain insights into market sentiment and make more informed trading decisions. For more detailed information on interpreting these patterns, Investopedia offers a comprehensive guide to candlestick analysis.
Support and resistance levels are critical concepts in price analysis. Support refers to a price level where a downtrend can be expected to pause due to a concentration of demand. Resistance, on the other hand, is where an uptrend can stall due to a concentration of selling. Understanding these levels can help you develop effective trading strategies!
By incorporating support and resistance into your trading strategies, you can better anticipate potential price movements and enhance your market analysis skills!
To enhance your chart analysis skills, consider using multiple timeframes when examining price movements. By comparing short-term charts (like 1-hour or 4-hour) with long-term charts (such as daily or weekly), you can gain a comprehensive understanding of trends and make more informed trading decisions.
Crypto price charts are visual representations of a cryptocurrency's price movements over time. They display data points like opening, closing, high, and low prices, helping traders identify trends and patterns.
Learning to read these charts helps beginners make informed decisions, identify market trends, spot potential buying/selling opportunities, and manage risks more effectively, especially in volatile markets.
Candlestick patterns are a popular method for displaying price movements, showing price action (open, close, high, low) for a specific timeframe. Bullish patterns indicate potential upward movement, while bearish patterns suggest potential downward movement.
Support levels are price points where a downtrend is expected to pause due to increased demand. Resistance levels are price points where an uptrend is expected to stall due to increased selling pressure.
You can improve by analyzing real-time charts, joining online forums, engaging in mock trading to practice without financial risk, and regularly reviewing your trading decisions to learn from them.
As we wrap up our exploration of crypto price charts, it's crucial to understand that learning to read these charts is foundational for anyone stepping into the cryptocurrency market. The ability to interpret price movements can significantly enhance your decision-making skills, allowing you to make informed trades and better navigate market volatility. Remember, a well-informed trader is often a successful trader!
We've also covered the essential tools and features that can help you analyze these charts effectively. From popular platforms like TradingView and CoinMarketCap to the critical indicators such as moving averages and RSI, arming yourself with the right resources is key to mastering the art of price analysis.
Now that you have the basics down, I encourage you to practice regularly. Here are a few steps to enhance your skills:
Continuous improvement is vital in the fast-paced world of cryptocurrency. Engaging with fellow traders will not only provide you with support but also expose you to different perspectives and strategies!
As you move forward, I urge you to explore various charting tools that suit your needs. Don't hesitate to dive in and start analyzing crypto price charts today! With practice, you'll develop the confidence to make decisions based on your analyses, which can lead to more effective trading strategies.
Recognizing market trends is essential for adjusting your trading strategies. Here’s why:
By honing your ability to identify these trends, you can position yourself better to capitalize on market movements, increasing your chances of success in this dynamic environment.
I’d love to hear your thoughts! Feel free to share your experiences or ask questions in the comments section below. Engaging with the community can provide invaluable insights and foster a supportive environment as we navigate the unpredictable world of cryptocurrency together.
Here is a quick recap of the important points discussed in the article:
Liam Harrington is a seasoned cryptocurrency analyst and market strategist with over a decade of experience in financial markets. He demystifies complex market trends, empowering traders and investors to make informed decisions. His expertise spans market analysis, risk management, and recovery strategies, making him a trusted voice in the crypto community.
At CryptoMarketCrash Insights, we're your essential guide through the volatile crypto landscape. We provide real-time news, expert analysis, and recovery strategies for Bitcoin and altcoin drops, empowering you to navigate market crashes effectively.
Navigating Crypto Volatility Together