
Market Capitulation Metrics
Indicators signaling peak panic selling:
- Puell Multiple: Assesses miner profitability, indicates oversold markets.
- NUPL (Net Unrealized Profit/Loss): Measures overall coin profitability and market sentiment.
In the world of cryptocurrency, understanding market dynamics is essential for navigating the ups and downs of trading. By leveraging on-chain metrics, you can turn uncertainty into an informed strategy. Let's delve into what you’ll gain from mastering these insights.
Understanding specific on-chain metrics is crucial for identifying market bottoms and early recovery signals in cryptocurrency. These indicators provide data-driven insights to navigate volatile markets.
Indicators signaling peak panic selling:
On-chain data revealing the start of a rebound:
Gauging market health and activity:
Understanding buying vs. selling intensity:
Have you ever felt overwhelmed by the complexities of the cryptocurrency market? Understanding on-chain metrics can be a game-changer for your investment strategy. At CryptoMarketCrash Insights, we believe that on-chain analysis plays a crucial role in predicting market trends and can help you navigate the choppy waters of crypto investments.
On-chain analysis refers to examining data directly from the blockchain, providing insights into the behavior of assets. By analyzing this data, we can spot patterns that may indicate future price movements. This approach allows traders like you to make informed decisions based on real-time information rather than speculation alone. For a comprehensive introduction to on-chain analysis, you can refer to insights from Galaxy Digital.
So, what exactly is on-chain analysis? It's a method of evaluating blockchain data to assess the health and activity surrounding a cryptocurrency. This type of analysis can reveal key trends about market sentiment and potential price movements. Here are a few reasons why on-chain analysis is essential:
Utilizing on-chain data effectively can enhance your ability to make strategic decisions. By focusing on these metrics, you can not only protect your investments during downturns but also capitalize on emerging opportunities! Resources like Santiment Academy offer detailed explanations of various on-chain metrics.
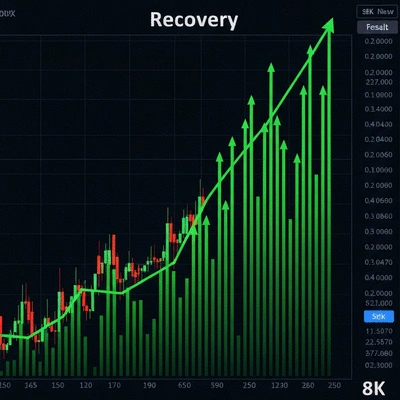
Recovery trends in the crypto market refer to the patterns that emerge after a significant price decline, signaling a potential rebound. Recognizing these trends is vital because they can indicate when it’s a good time to invest or adjust your portfolio. Here are the key aspects of recovery trends:
Understanding these recovery trends is not just academic; it's about making actionable decisions that align with your investment goals. As we dive deeper into on-chain metrics, you'll become more equipped to identify these crucial signals in the market. For instance, recent reports highlight how on-chain activity is signaling recovery for cryptocurrencies like Solana.
In the unpredictable world of cryptocurrency, knowing when to enter or exit a position is paramount. Let's explore some essential metrics that can help you identify market bottoms and recovery signals effectively!
One of the first steps in recognizing a market recovery is identifying when capitulation has occurred. This is a critical phase where panic selling reaches its peak, often leading to the lowest prices before a rebound:
Using these metrics effectively can help you pinpoint when the market is ripe for recovery. By monitoring such indicators, you’ll be better positioned to make informed investment decisions.
As we delve into on-chain data, we can uncover various metrics that signal the beginning of a recovery phase. Recognizing these early signals can lead to strategic investment opportunities:
Understanding these indicators allows you to act swiftly, ensuring you don’t miss out on potentially lucrative recovery phases!
The number of active addresses on a blockchain can be a powerful indicator of increasing market interest. When more addresses are actively participating, it often reflects a growing community and investor confidence, marking an essential phase in recovery.
Transaction volume is another vital metric that reveals the health of a market. A significant increase in transaction volume can indicate that investors are becoming more active, which often precedes price recoveries. Monitoring this metric can provide you with early insights into potential market movements.
Exchange flow metrics give us insight into the buying versus selling intensity during recovery. When inflows outweigh outflows, it can signal a bullish sentiment, while the opposite might indicate bearish activity. Keeping an eye on these flows can assist you in making timely decisions that align with market trends.
On-chain analysis is the process of examining data directly from a blockchain to gain insights into the health, activity, and sentiment surrounding a cryptocurrency. This data helps predict future price movements and informs investment strategies.
It provides transparency, real-time insights into market activity, and predictive power by allowing investors to understand historical trends and anticipate future market behavior, leading to more informed decisions.
Market capitulation metrics are indicators that signal peak panic selling in the market, often preceding a rebound. Key metrics include the Puell Multiple (assessing miner profitability) and NUPL (Net Unrealized Profit/Loss, measuring overall coin profitability and sentiment).
Early recovery signals include accumulation phases (increased buying post-crash), a rise in active addresses (indicating growing interest), and increased transaction volume (showing heightened market activity).
A rise in active addresses suggests growing community engagement and investor confidence. Increased transaction volume often precedes price recoveries, as it indicates investors are becoming more active and accumulating assets.
Exchange flows analyze the intensity of buying vs. selling. When inflows (deposits to exchanges) outweigh outflows (withdrawals from exchanges), it can signal bullish sentiment. Monitoring these flows helps traders align with market trends for strategic entry or exit points.
When analyzing on-chain metrics, consider utilizing a combination of indicators for a more holistic view of market conditions. For instance, pairing the Puell Multiple with Active Addresses can provide deeper insights into market sentiment and recovery signals, helping you make more informed trading decisions.
As we navigate the complex landscape of cryptocurrency, it’s crucial to recap the essential on-chain metrics and frameworks that can help us predict market recovery. These metrics provide insights into market behavior, enabling traders and investors to make more informed decisions.
Throughout our exploration, we’ve discussed various indicators like the Puell Multiple and NUPL that signal market capitulation and recovery phases. Understanding these metrics not only aids in identifying the right moments to enter or exit trades but also fosters a deeper awareness of market dynamics.
By synthesizing these metrics with our 3-step recovery confirmation framework, we can paint a clearer picture of the market's trajectory. This synthesis empowers us to not only react but also strategize effectively in times of volatility.
As traders and investors, it's paramount to adopt a strategic approach when dealing with market recovery. The world of cryptocurrency is notoriously volatile, which is why relying on on-chain metrics is essential for informed decision-making.
While it’s easy to get swept up in market euphoria or despair, maintaining a disciplined approach can help mitigate risks. Let’s remember these key points for a strategic recovery approach:
As the founder of CryptoMarketCrash Insights, I've seen firsthand how a measured perspective can transform a trader’s experience. By focusing on data-driven decisions rather than impulsive reactions, we can navigate the market more effectively.
I invite you to share your experiences and insights regarding market recovery trends. Your perspectives are valuable to our community and can foster discussions that lead to greater learning for everyone involved. How have on-chain metrics influenced your trading decisions? What strategies have you found effective during recovery phases?
Finally, I encourage you to stay engaged and informed. Sign up for alerts from CryptoMarketCrash Insights to keep up with the latest updates on on-chain metrics, recovery strategies, and market trends. Together, we can build a well-informed community ready to tackle the challenges and seize the opportunities that the cryptocurrency market presents!
Here is a quick recap of the important points discussed in the article:
Liam Harrington is a seasoned cryptocurrency analyst and market strategist with over a decade of experience in financial markets. He demystifies complex market trends, empowering traders and investors to make informed decisions. His expertise spans market analysis, risk management, and recovery strategies, making him a trusted voice in the crypto community.
At CryptoMarketCrash Insights, we're your essential guide through the volatile crypto landscape. We provide real-time news, expert analysis, and recovery strategies for Bitcoin and altcoin drops, empowering you to navigate market crashes effectively.
Navigating Crypto Volatility Together